Technical Analysis Tools for Crypto Trading
- Understanding Technical Analysis in Crypto Trading
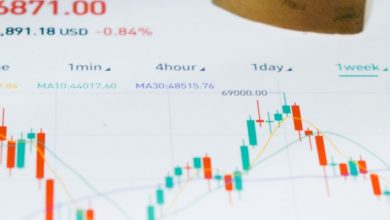
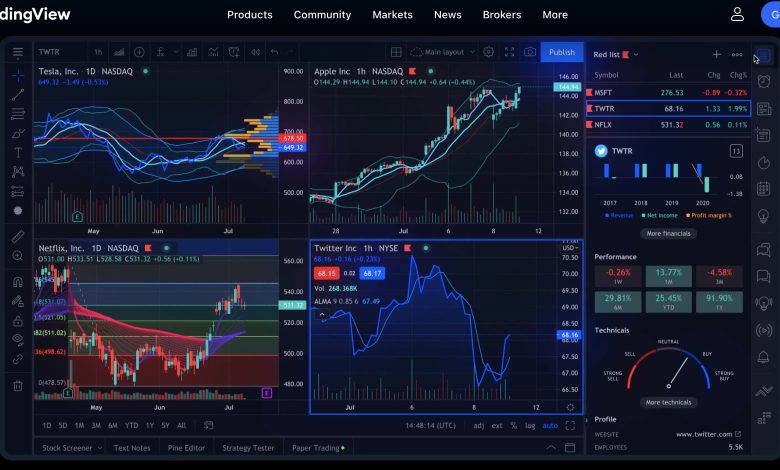
- Popular Technical Indicators for Crypto Traders
- How to Use Moving Averages in Crypto Trading
- The Role of Support and Resistance Levels in Crypto Analysis
- Using RSI and MACD for Crypto Trading Strategies
- The Importance of Volume in Technical Analysis for Cryptocurrencies
Understanding Technical Analysis in Crypto Trading
Understanding technical analysis in crypto trading is crucial for making informed decisions when buying or selling digital assets. Technical analysis involves studying historical price data and market trends to predict future price movements. By analyzing charts and using various technical indicators, traders can identify patterns and trends that may help them anticipate market movements.
One of the key concepts in technical analysis is support and resistance levels. Support levels are price points where a cryptocurrency tends to find buying interest, preventing it from falling further. Resistance levels, on the other hand, are price points where selling interest is strong enough to prevent the price from rising. By identifying these levels, traders can make more informed decisions about when to enter or exit a trade.
Another important aspect of technical analysis is the use of technical indicators. These are mathematical calculations based on price, volume, or open interest data. Popular technical indicators used in crypto trading include moving averages, relative strength index (RSI), and Bollinger Bands. Traders use these indicators to confirm trends, identify potential reversals, or generate buy and sell signals.
Popular Technical Indicators for Crypto Traders
When it comes to technical analysis in crypto trading, there are several popular indicators that traders often rely on to make informed decisions. These indicators help traders analyze price trends, identify potential entry and exit points, and predict future market movements.
- Relative Strength Index (RSI): The RSI is a momentum oscillator that measures the speed and change of price movements. It is used to determine overbought or oversold conditions in the market, indicating potential reversal points.
- Moving Averages: Moving averages are used to smooth out price data and identify trends over a specific period. Traders often look at the crossover of different moving averages to confirm buy or sell signals.
- Bollinger Bands: Bollinger Bands consist of a simple moving average and two standard deviations above and below the SMA. They help traders identify volatility and potential price breakouts.
- MACD (Moving Average Convergence Divergence): The MACD is a trend-following momentum indicator that shows the relationship between two moving averages of an asset’s price. Traders use it to identify changes in the strength, direction, momentum, and duration of a trend.
- Fibonacci Retracement: Fibonacci retracement levels are horizontal lines that indicate where support and resistance are likely to occur. Traders use these levels to identify potential reversal points in the market.
By incorporating these popular technical indicators into their trading strategies, crypto traders can gain valuable insights into market dynamics and make more informed decisions. It is essential to understand how each indicator works and how to interpret their signals accurately to maximize trading success.
How to Use Moving Averages in Crypto Trading
Moving averages are a popular technical analysis tool used by traders in the cryptocurrency market to identify trends and potential entry or exit points for trades. By calculating the average price of an asset over a specific period of time, moving averages help smooth out price fluctuations and provide a clearer picture of the overall trend.
There are two main types of moving averages that traders commonly use: the simple moving average (SMA) and the exponential moving average (EMA). The SMA gives equal weight to each data point in the calculation, while the EMA places more emphasis on recent prices, making it more responsive to current market conditions.
To use moving averages in crypto trading, traders typically look for crossovers between different moving averages or use them as support and resistance levels. For example, when a short-term moving average crosses above a long-term moving average, it may signal a bullish trend, while a crossover in the opposite direction could indicate a bearish trend.
It’s important to note that moving averages are lagging indicators, meaning they are based on past price data and may not always accurately predict future price movements. As with any technical analysis tool, it’s essential to use moving averages in conjunction with other indicators and risk management strategies to make informed trading decisions.
The Role of Support and Resistance Levels in Crypto Analysis
Support and resistance levels play a crucial role in technical analysis for crypto trading. These levels are key indicators that help traders identify potential entry and exit points for their trades. Support levels are price points where a cryptocurrency tends to find buying interest, preventing it from falling further. On the other hand, resistance levels are price points where selling interest is typically strong, preventing the price from rising.
By analyzing these support and resistance levels, traders can make more informed decisions about when to buy or sell a particular cryptocurrency. When the price of a cryptocurrency approaches a support level, it may be a good time to buy as there is a higher likelihood of a price bounce. Conversely, when the price approaches a resistance level, it may be a good time to sell as there is a higher likelihood of a price reversal.
Support and resistance levels can also help traders set stop-loss orders to manage their risk. By placing a stop-loss order just below a support level, traders can limit their losses if the price breaks below that level. Similarly, placing a stop-loss order just above a resistance level can help protect profits if the price fails to break through that level.
Using RSI and MACD for Crypto Trading Strategies
When it comes to crypto trading strategies, two popular technical analysis tools that traders often use are the Relative Strength Index (RSI) and the Moving Average Convergence Divergence (MACD). These indicators can help traders make informed decisions based on market trends and momentum.
The RSI is a momentum oscillator that measures the speed and change of price movements. It ranges from 0 to 100 and is typically used to identify overbought or oversold conditions in an asset. Traders can use the RSI to determine when an asset is likely to reverse direction, providing potential entry or exit points for trades.
On the other hand, the MACD is a trend-following momentum indicator that shows the relationship between two moving averages of an asset’s price. It consists of a MACD line, signal line, and histogram, which can help traders identify changes in the strength, direction, momentum, and duration of a trend.
By combining the RSI and MACD in their crypto trading strategies, traders can gain a more comprehensive view of market conditions and potential opportunities. For example, when the RSI indicates an overbought condition and the MACD shows a bearish crossover, it may signal a potential reversal in price.
Overall, incorporating the RSI and MACD into crypto trading strategies can help traders make more informed decisions and improve their chances of success in the volatile cryptocurrency markets.
The Importance of Volume in Technical Analysis for Cryptocurrencies
Volume is a crucial aspect of technical analysis when it comes to trading cryptocurrencies. It refers to the number of tokens or coins that are being traded within a specific time frame. Understanding volume can provide valuable insights into market trends and potential price movements.
High volume typically indicates strong market interest and can confirm the validity of a price trend. On the other hand, low volume may suggest a lack of interest or participation in the market, making price movements less reliable. Traders often use volume indicators to confirm the strength of a trend or to identify potential reversals.
By analyzing volume along with price movements, traders can gain a more comprehensive view of market dynamics. For example, a price increase accompanied by high volume is more likely to be sustainable compared to one with low volume. Similarly, a price decrease on high volume may signal a significant shift in market sentiment.
Overall, incorporating volume analysis into technical analysis can help traders make more informed decisions and improve their trading strategies. It provides valuable information about market activity and can help identify potential trading opportunities. Therefore, paying attention to volume is essential for successful cryptocurrency trading.